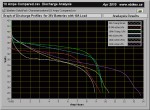
Battery Discharge Curves
There is tons and tons of stuff that goes on behind the scenes here which is pretty slow to percolate onto the webpage, but every now and then we get to something. We have just added our own battery discharge test data for all of the 36V packs that we offer on our site, from data collected over the past year with our own in-house computer controlled automated testing apparatus. This should help people better understand the differences in discharge profile and behaviour from the various chemistry and 'C' rate options. The specs for the individual packs can be seen below:

8AH NiCad

eZee LiFe

9Ah LiMn

10Ah LiPoly

14Ah LiPoly

Triang. LiFe

10A Curves Compared
We have also combined all of the 10A curves from each of the different chemistries and super imposed them on a single plot in the graph on the left. In this way, you can see side by side how they all stack up at different points in the discharge.


 Canadian


