Trip Analyzer Update - Oops
Sometimes we do a lot of work on a project and totally forget to announce it anywhere. That happened a few months ago when we finished a large round of enhancements to the online CA Trip Analyzer software, courtesy of the hard work of our UBC co-op students Mila and Shivan. Then moved onto our next endeavors and forgot to make a peep.
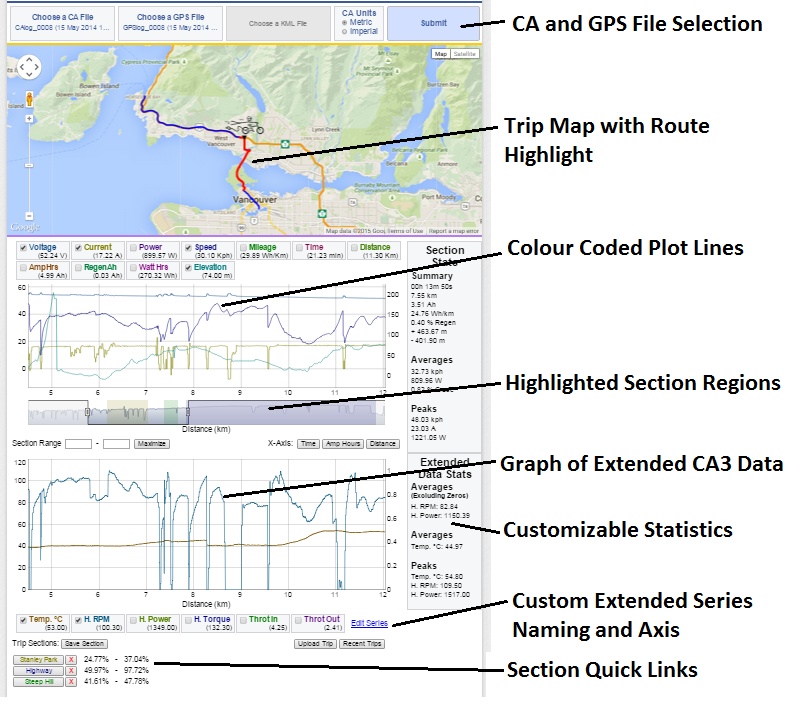
The latest enhancements apply most specifically to the V3 Cycle Analyst devices, since the software now shows all the extended data such as human torque, motor temperature, pedal cadence etc. This extended data is shown on a second graph allowing you to customize not only which items to display, but also whether they scale on the left or right axis and how or if numeric stats on the right should be computed.

We've also made it so that named trip sections are highlighted in different colours and shown on the slider bar, allowing for easier visualization of the trip regions when communicating or sharing adventures. All of these capabilities are now summarized in the FAQ section. As always we appreciate feedback from people using these web tools. If you've got an interesting trip upload to share, please send the URL our way.


 Canadian


